54. Debugging
54.1. Debug rendering
AGX has an internal scheme for rendering rigid bodies, geometries and constraints (including contacts). It is handled by a class agxRender::RenderManager. When debug-rendering is enabled, this class will dispatch calls for rendering and create agxRender::RenderProxy’s. A render proxy is a placeholder for a class that can be rendered in the clients rendering system. By default if AGX is built with OpenSceneGraph, there is an implementation of render proxies for that scene graph.
Each primitive has its own render proxy which need to be implemented at the client side. Responsible for creating these proxies is the agxRender::RenderProxyFactory, a class which is derived to a specialization for each rendering system. The class agxOSG::RenderProxyFactory is one such specialization for OSG.
This rendering system should not be considered to be the rendering system for your simulations in simulators etc. It is merely a system for debugging your simulation, being able to see if bodies are enabled, static, kinematic, sleeping. To see where your constraints are attached to bodies etc. When you need a proper rendering engine, you should connect that directly through the geometries and rigid bodies.
Class |
Description |
|---|---|
agxRender::RenderManager |
Manages the debug rendering system. Called from agxSDK::Simulation::stepForward() |
*agxRender::RenderProxyFactory |
Abstract base class responsible for creating agxRender::RenderProxy for rendering in a specific rendering system. |
agxRender::RenderProxy |
Abstract base class for all renderable objects. Derived down to various primitives (sphere, cylinder, etc.) |
*SphereProxy, *CylinderProxy, *LineProxy, *TextProxy, *PlaneProxy, *CapsuleProxy, *BoxProxy, *HeightfieldProxy, *TrimeshProxy |
Specialization of a RenderProxy for each supported shape. |
agxRender::GraphRenderer |
An abstract class for rendering graphs related to statistics information. |
Classes marked with * in Table 54.1: indicates that they need to be implemented and adopted for your specific rendering engine.
Objects with different properties are rendered differently: geometries belonging to static bodies are rendered in blue, whereas geometries associated to dynamic bodies are rendered in green. Sensors are rendered with a lighter blue.
54.1.1. RenderManager
agxRender::RenderManager. This class is responsible for updating all the RenderProxy instances that are created during debug rendering. Each render manager need a reference to a RenderProxyFactory, specific for a rendering engine. Several render managers can use the same RenderProxyFactory, so if you are using several agxSDK::Simulation, you can assign the same RenderProxyFactory to those simulations.
// Create a render proxy factory, specific for OpenSceneGraph
agxRender::RenderProxyFactoryRef factory = new agxOSG::RenderProxyFactory;

// Create a simulation
agxSDK::SimulationRef sim = new agxSDK::Simulation;

// Tell this simulation's render manager to use our factory
sim->getRendermanager()->setProxyFactory( factory );

// Create another simulation, use the same factory for the debug rendering
agxSDK::SimulationRef sim2 = new agxSDK::Simulation;
sim2->getRendermanager()->setProxyFactory( factory );
During a Simulation::stepForward(), a call to RenderManager::update() will be called which in turn will query the render proxy factory for spheres, lines, cylinders etc.
There is no cache functionality implemented in the RenderManager, that is, when a render proxy is required, a call to the render proxy factory will be executed. There will be no storage of unused render proxies in the render manager. If caching is required (to achieve better performance for scenes where the number of proxies varies a lot), it has to be done in the render proxy factory implementation
54.1.2. Global transformation
Because simulation can occur in any coordinate system, there might be limitations to what the rendering system can handle. For example, if a simulation occurs far away from the origin (0,0,0) of the world coordinate system, there might be precision problems in the rendering system. To handle this, the RenderManager has a global transformation that will be applied to all render proxies. This transformation can be set using the method:
agxRender::RenderProxyFactory::setGlobalTransform
This should be set to the inverse of the transformation of any object that should be rendered in (0,0,0) in the rendering system.
// Assume centerObject is an object in the scene that should be at (0,0,0) in the rendering system
agx::AffineMatrix4x4 matrixTransform = centerObject->getTransform().inverse();
simulation->getRenderManager()->getProxyFactory()->setGlobalTransform(matrixTransform);
54.1.3. Scale factor
By default the overall scaling of debug rendering is configured to fit a scene where objects are around 1 m. For a very small or very large scene it might be useful to increase/decrease the size of the rendered constraints, contacts etc. This can be done using the setScaleFactor method:
simulation->getRenderManager()->setScaleFactor(0.1f);
The scale factor can also be controlled with the keyboard in an application based on the agxOSG::ExampleApplication class such as agxViewer.
Note that the application/script might have changed the mapping for those keys.
For more information see keybindings
54.1.4. Render flags
There are three methods that control what should be rendered by the render manager:
void setFlags( unsigned int flags );
void enableFlags( unsigned int  flags );
void disableFlags( unsigned int  flags );
setFlags will override the current set of flags with the specified one. enableFlags will enable the specified flags and leave the rest untouched. disableFlags will disable the specific flags and leave the rest untouched.
As an example, to specify that the default set of flags should be used, plus the rendering of bounding volumes (which is not enabled by default) the following call can be done:
// Render default, plus the bounding volumes
simulation->getRenderManager()->setFlags(agxRender::RENDER_DEFAULT|
                                                                        agxRender::RENDER_BOUNDING_VOLUMES);
54.1.5. Renderable objects
There are various types of objects that will be rendered in the debug rendering:
54.1.5.1. Shapes
All shapes (agxCollide::Shape) for all enabled geometries will be rendered. Every time a new shape is added/removed from a geometry part of the simulation, it will be added/removed from the debug rendering system (if it is enabled). A proxy will be associated for each shape. When the shape is deleted/removed, the proxy will get a call to onChange(REMOVE) (see below). For each time step, the state (color, alpha) and shape (size/form) will be synchronized with the corresponding AGX shape. For most of the time, only transform changes will be updated for these shapes, which should be efficiently handled by the rendering engine. The rendering of shapes will occur of the flag RENDER_GEOMETRIES is enabled in the render manager.
54.1.5.2. Constraints
The constraints in AGX has a virtual render method. This method will be called whenever the RENDER_CONSTRAINTS flag is enabled in the render manager. These render methods, will query the render manager for various shapes such as cylinder, spheres or lines. These queries will be dispatched to the specific RenderProxyFactory.
54.1.5.3. Renderables
There is a special class, agx::Renderable, which can be used for some specific rendering. It has a virtual method render which will be called from the RenderManager if the RENDER_RENDERABLES flag is enabled in the render manager.
54.1.5.4. Bodies
For each enabled RigidBody a sphere proxy will be rendered. These sphere proxies will be acquired via the render manager to the specific render proxy factory. This will occur if the RENDER_BODIES flag is enabled.
54.1.5.5. Contacts
Contacts will be rendered analogous to bodies. A sphere and a line will be acquired from the render manager. This occurs if the flag RENDER_CONTACTS is enabled.
54.1.5.6. Statistics
Statistics involve both the textual information (as collected by the agx::Statistics class) and graph drawing, showing some of the statistics as visual graphs on the screen. This occurs if the RENDER_STATISTICS is enabled.
54.1.6. Disable debug rendering for a specific geometry
By adding a specific property to a geometry, debug rendering can be disabled for that specific geometry. This is done by adding the property “DebugRenderEnabled” with value false to the geometry:
geometry->getPropertyContainer()->addPropertyBool( "DebugRenderEnabled", false );
Or in python:
geometry.getPropertyContainer().addPropertyBool( "DebugRenderEnabled", False )
54.1.7. Implementation of custom debug rendering
54.1.7.1. agxRender::RenderProxyFactory
This class need to be specialized for any specific rendering engine. In <agxOSG/RenderProxy.h> an implementation for OpenSceneGraph can be found. The virtual methods that need to be implemented are:
/// Interface for creating and returning a SphereProxy
virtual SphereProxy *createSphere( float radius ) = 0;

/// Interface for creating and returning a BoxProxy
virtual BoxProxy *createBox( const agx::Vec3& halfExtents ) = 0;

/// Interface for creating and returning a LineProxy
virtual LineProxy *createLine( const agx::Vec3& p1, const agx::Vec3& p2 ) = 0;

/// Interface for creating and returning a CylinderProxy
virtual CylinderProxy *createCylinder( float radius, float height ) = 0;

/// Interface for creating and returning a ConeProxy
virtual ConeProxy *createCone( float radius, float height ) = 0;

/// Interface for creating and returning a CapsuleProxy
virtual CapsuleProxy *createCapsule( float radius, float height ) = 0;

/// Interface for creating and returning TextProxy
virtual TextProxy *createText( const agx::String& text, const agx::Vec3& pos ) = 0;

/// Interface for creating and returning PlaneProxy
virtual PlaneProxy *createPlane( const agx::Vec3& normal, agx::Real distance ) = 0;

/// Interface for creating and returning HeightfieldProxy
virtual HeightFieldProxy *createHeightfield( const agxCollide::HeightField *hf ) = 0;

/// Interface for creating and returning TrimeshProxy
virtual TrimeshProxy *createTrimesh( const agxCollide::Trimesh *mesh ) = 0;
Each of these methods are responsible for returning a RenderProxy of a specific type based on the in-data. The RenderProxy is then responsible for holding this renderable reference into the render system in use. As an example, the code for creating a sphere OpenSceneGraph looks like this:
agxRender::SphereProxy* RenderProxyFactory::createSphere( float radius )
{
  ShapeData<osg::Sphere> sphereData;
  sphereData.shape = new osg::Sphere();
  sphereData.shape->setRadius( radius );
  sphereData.geode = createGeode( sphereData.shape, &sphereData.shapeDrawable );
  sphereData.geode->setName("SphereGeode");

  // Create a new Sphere proxy including the rendering representation in OSG
  agxOSG::SphereProxy *proxy = new agxOSG::SphereProxy( radius, sphereData, this );

  addChild( proxy->getNode() ); // Add the node to the scenegraph (hold by the factory)

  return proxy; // Return the proxy
}
The specific data required will differ between rendering engines.
54.1.8. agxRender::RenderProxy
Each subclass (primitive type) of RenderProxy need to be implemented for the specific render engine. The virtual methods that can/should be implemented are:
54.1.8.1. onChange
This method need to be implemented (pure virtual method) in your representation of a RenderProxy. It will receive calls from each of the set methods described below. Whenever a proxy is required to change color, shape, alpha or transform, this method will be called. Based on the event-type described in the enum agxRender::RenderProxy::EventType, you should update your rendering representation with the new current value. For the OpenSceneGraph implementation a code snipped looks like the following:
void onChange( RenderProxy::EventType type) {
  switch( type ){
      case (RenderProxy::ENABLE):
      setEnableOSG(getEnable());
      break;
      case (RenderProxy::ALPHA):
      setAlphaOSG(getAlpha());
      break;
      case (RenderProxy::TRANSFORM):
      setTransformOSG(getTransform());
      break;
...
So based on the event type different calls are done to the rendering API to reflect the changes into the rendering implementation.
54.1.8.2. updateShape
This method need to be implemented (pure virtual method) need to be implemented in your representation of a RenderProxy. It is specific for each shape. When this method is called (probably from your specific implementation of onChange(SHAPE)) the render proxy implementation need to update the rendering representation to reflect changes, such as changing radius for a sphere, change the triangle mesh structure or changing the size of a box.
A code snippet from the OpenSceneGraph representation illustrate how it can be done:
void SphereProxy::updateShape( )
{
  // Get the agx representation of the shape associated to this proxy
  const agxCollide::Sphere *sphere = getCastShape();
  if (sphere) // If there IS a shape associated, then read the radius from that
    m_radius = sphere->getRadius();

  // If radius is the same, then just dont do anything
  if (agx::_equivalent((float)m_radius, m_data.shape->getRadius()))
    return;

  // Change the radius of the osg-sphere
  m_data.shape->setRadius(m_radius);
  m_data.geode->getDrawable(0)->dirtyDisplayList();
}
54.1.8.3. setTransform
virtual void RenderProxy::setTransform( const agx::AffineMatrix4x4& transform );
This method will set the m_transform member of the RenderProxy, then it will call onChange( TRANSFORM ) which indicates that the transform is changed. If m_transform == transform, no call to onChange will occur (to avoid unnecessary state changes. If you override this method, store transformation in m_transform and call onChange(TRANSFORM).
54.1.8.4. setColor
Store a color in m_color and call onChange(COLOR). If color == m_color, no call to onChange will occur to reduce state changes. If you override this method, update m_color and call onChange(COLOR).
54.1.8.5. getColor
This method return the color of the proxy, the value in m_color. You can override this method to return the color as stored somewhere else, just make sure you sync with the m_color member attribute.
54.1.8.6. setAlpha
Set the transparency value of the proxy. The implementation will store alpha in m_alpha and call onChange(ALPHA). If you override this implementation, you need to update m_alpha, and call onChange(ALPHA).
54.1.8.7. getAlpha
Return the value of the m_alpha member attribute. If you override setAlpha you might want to also override this method.
54.1.8.8. agxRender::GraphRenderer
This class is specific for each rendering engine. An implementation for OpenSceneGraph can be found in <agxOSG/Graphrenderer.h> and corresponding .cpp file.
For more information, see the doxygen generated documentation for the class.
54.2. Web Debugger
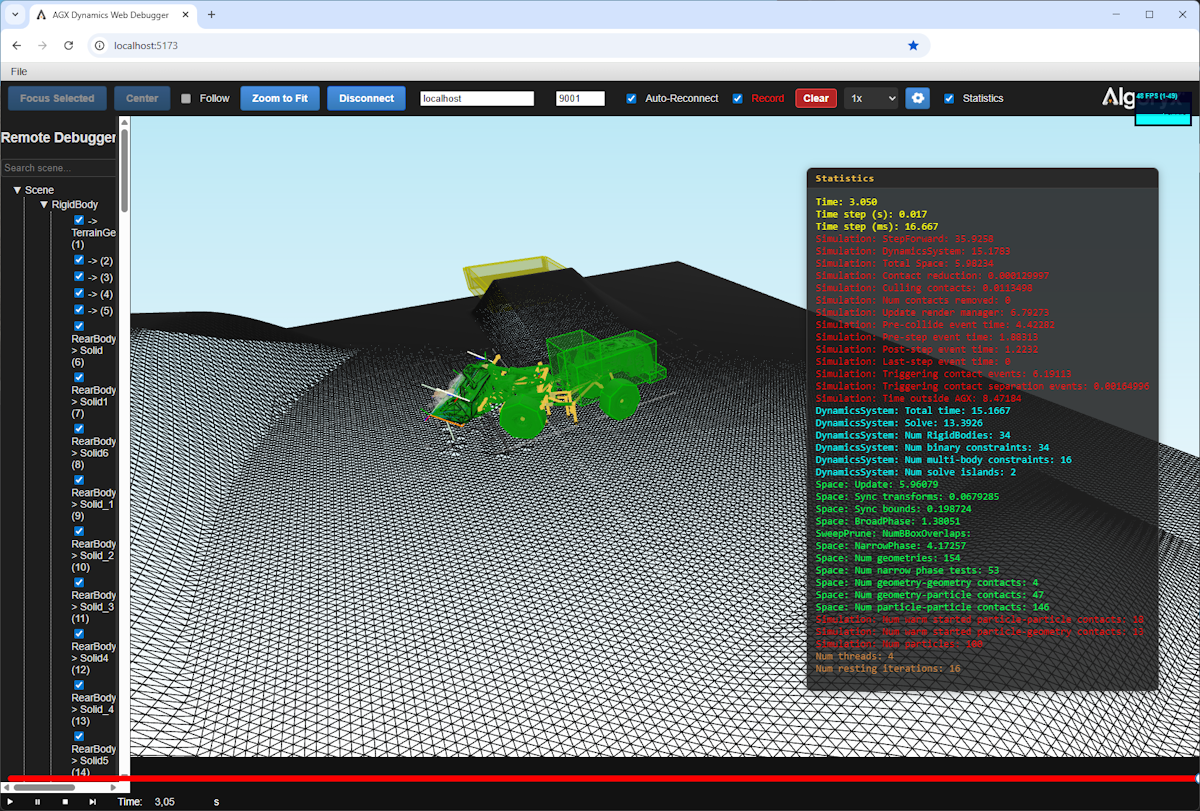
Fig. 54.1 Overview of the Web Debugger interface.
The Web Debugger is a tool that allows you to visualize and debug AGX Dynamics simulations in a web browser with minimal impact on the simulation performance. It provides a user-friendly interface to inspect the simulation state, view geometries, contacts and constraints. You can record and save a session for later analysis. The information presented is the same as what is available in the debug rendering system, but presented in a web interface.
It can be useful if you have multiple simulations running on different machines and you want to investigate the simulation state without having to login to each machine.
Note
Currently only the visual representation of the simulation is supported. No dynamics information such as forces, velocities, or other simulation parameters are available in the Web Debugger.
You cannot use the debug view in agxViewer/ExampleApplication at the same time as the Web Debugger.
54.2.1. Start a web debugger session
The Web debugger consists of two parts: A web server that serves the Web Debugger interface (client) and a simulation that streams the simulation state to the web client.
To start the Web Debugger client, you first need to start a web server that serves the Web Debugger interface. This can be done through command scripts both in Windows and Linux.
In Windows you can locate the scripts in bin/x64/WebDebugger and run the following command:
> run_server.bat
In Linux, you can locate the scripts in bin/x64/WebDebugger and run the following command:
$ ./run_server.sh
This will start a web server that serves the Web Debugger interface on port 5173 by default. Next you can connect to the Web Debugger interface by navigating to http://localhost:5173 in your web browser and you will see the Web Debugger interface.
Note
You can change the port in the run_server.bat or run_server.sh script to use a different port than 5173.
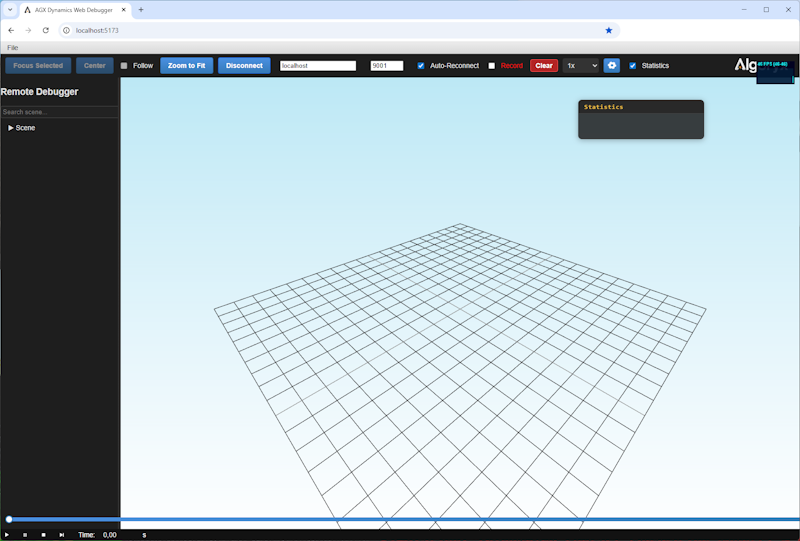
Fig. 54.2 Starting view of the Web Debugger interface.
To create a simulation session to which you can connect, you can use the agxViewer application or any other application that uses AGX Dynamics.
Through the agxViewer application, you can start a web debugger session by using the command line argument --webDebugger 9001. This will start a web server that serves the Web Debugger interface on port 9001 on the local machine.
Note that it might be a good idea to start the simulation in paused mode by using the -p argument, so that you can connect to the Web Debugger before the simulation starts. This is only important if you are keen on recording every single time step of your simulation.
> agxViewer --webDebugger 9001 data/python/overheadConveyor.agxPy -p
Note
If you run the simulation on a remote machine, you need to replace the localhost with the IP address of the remote machine in the URL to access the Web Debugger.
The Web Debugger can also be enabled via the agxSDK::Simulation::setEnableWebDebugger method:
agxSDK::SimulationRef simulation = new agxSDK::Simulation();
simulation->setEnableWebDebugger( true, 9001 );
You then access the Web Debugger by navigating to http://localhost:5173 in your web browser. The Web Debugger will automatically connect to the simulation and start visualizing the simulation state.
If you want to use a different port, you can specify it as the second argument to the method. The default port is 9001. By using different ports for different simulations, you can connect to multiple simulations from the same Web Debugger interface. Just open a new tab, connect to the Web Debugger and specify the port/host of the simulation you want to connect to.
Note
Because the Web Debugger is based on the Debug rendering system, there might be a need to transform the scene to origin (0, 0, 0) to avoid precision issues. See Global transformation
agxSDK::SimulationRef simulation = new agxSDK::Simulation();
simulation->setEnableWebDebugger( true, 9001 );

// Set the global transform after enabling the web debugger
simulation->getRenderManager()->getProxyFactory()->setGlobalTransform(matrixTransform);
54.2.2. User interface
54.2.2.1. Playback control
At the bottom of the interface, you have playback controls to start, stop, pause the simulation view.
Play: This button will start the simulation playback.
Pause: This button will pause the simulation playback.
Stop: This button will stop the simulation playback and reset the time to the beginning of the recorded session or the current simulation.
Jump to end: This button will jump to the end of the recorded session or the current simulation.
Time text field: This text field allows you to enter a specific time in the recorded session or the current simulation. You can use this to jump to a specific time in the playback.
Time slider: This slider allows you to scrub through the recorded session or the current simulation. You can use it to quickly navigate to a specific time in the playback.
54.2.2.2. Keyboard bindings
Left arrow: Step backward in the simulation.
Right arrow: Step forward in the simulation.
Space: Pause or resume the simulation.
e / End: Jump to the end of the recorded session or the current simulation.
b / Home: Jump to the beginning of the recorded session or the current simulation.
WASD + QE: Move the camera in the 3D view.
h: Toggle visibility of any currently selected object.
54.2.2.3. Mouse controls
Left click + drag: Rotate the camera around the target point.
Right click + drag: Pan the camera.
Scroll wheel: Zoom in and out.
Middle click + drag: Zoom in out.
Double click: Select the intersected object and set the rotation point for the camera.
54.2.2.5. Session control
Focus Selected: You can focus the view on a selected geometry (which can be a geometry, contact, or constraint) by clicking the “Focus Selected” button. This will center the view on the selected item and zoom in to make it more visible.
Center: This will center the scene around a selected object. This is done on the server side, so this option is only available when you are connected. Also, it will only transform data sent _after_ it was pressed.
Follow: You can enable the “Follow” mode by clicking the “Follow” button. This will make the camera follow the selected geometry as it moves in the simulation.
Zoom to Fit: You can zoom the view to fit all or the selected geometries in the simulation by clicking the “Zoom to Fit” button. This will adjust the camera position and zoom level to show all geometries in the simulation.
Connect: You can connect to a simulation by clicking the “Connect” button.
Simulation Address: You can specify the IP address of the simulation to connect to in the “Simulation IP Address” field. This is useful if you are running the simulation on a remote machine.
Simulation Port: You can specify the port of the simulation to connect to in the “Simulation Port” field. This is useful if you are running the simulation on a remote machine or if you want to connect to a different simulation instance.-
- Auto-Reconnect: If checked, the Web Debugger will automatically try to reconnect to a simulation. This is only possible if the current simulation is paused/stopped.
Note that you should uncheck this button if you do not want the current session to be overwritten when connecting to a new simulation.
Record: If checked, the Web Debugger will record the current session. This means that the simulation state, geometries, contacts, and constraints will be saved to a file when the session is stopped.
Clear: With this button you can clear the recorded data and start from a new recording.
Speed dropdown: You can select the speed of the simulation playback from the dropdown menu. The available speeds are 0.1x, 0.5x, 1x, 2x, and 4x. This allows you to slow down or speed up the playback of the simulation.
Statistics: Uncheck this box to disable the statistics view in the Web Debugger.
54.2.2.6. Settings
Settings for the Web Debugger can be accessed by clicking the gear icon in the top right corner of the interface. The settings allow you to configure the following:
Enable logging: Check this box to enable logging of the Web Debugger. This will log messages to the browser console, which can be useful for debugging issues with the Web Debugger.
Show statistics: Check this box to display the statistics window at startup of the Web Debugger.
Show Grid: Check this box to enable the grid in the Web Debugger view. The grid can help you to visualize the scale and position of the geometries in the simulation.
Cell size: You can adjust the size of the grid cells using the slider. This will affect how many grid lines are shown in the view.
Total size: You can adjust the total size of the grid using the slider. This will affect how far the grid extends in the view.
Solid background: You can switch between a light and dark background color for the Web Debugger interface.
Camera speed: You can adjust the camera speed using the slider. This will affect how fast the camera moves when you navigate the view with WASD keys.
Up Axis: You can select the up axis for the Web Debugger view. The available options are Left handed Z-up (Z+), Right handed Y-up (+Y) and right handed X-Up (X+).
Primitive tesselation: Specifies the tesselation ratio of primitives. Default value is 10.
The settings can be reset using the “Reset settings” button at the bottom of the settings panel.
54.2.2.7. Scene browser
There will be a representation of the current simulation in the scene browser. This will show the geometries, contacts, and constraints in the simulation. You can disable the rendering of individual objects. In the Search scene field, you can filter the objects in the scene browser by name.
Note
If you experience problems it is always a good idea to open the browser console (F12) and check for any error messages.
54.3. Remote debugging
We strongly recommend using the Web Debugger for remote viewing of a running simulation. However, if you want to use the traditional remote debugging feature, it is described below.
Running AGX Dynamics embedded into a simulation framework, it can be sometimes hard to understand what is going on during a simulation. Therefore there is a feature which allows for some remote viewing capabilities.
In short, it is utilizing the serialization of a agxSDK::Simulation over a network port. This means that the whole simulation will be serialized, transmitted over the network and de-serialized and visualized in the agxViewer application.
Note
The Remote debugging feature should not be part of any production code, but rather as a way of looking into a running simulation. Enabling remote debugging will greatly affect the performance.
First, let´s have a look at how this works by using the command arguments for agxViewer.
54.3.1. Debugging agxViewer
Start a command prompt with the correct AGX runtime environment setup.
Next, start another command window (you will use one for the remote viewer and one for running the simulation).
From the first command prompt:
> agxViewer --server --serverTimeStep 0.1 --serverWait 0 data/python/overheadConveyor.agxPy
[Warning: agxSDK::Simulation::setEnableRemoteDebugging] Starting debugging server at port: 9999
Loading scene took 0.705391 sec
and from the second command prompt write:
> agxViewer --connect localhost:9999 -p --renderDebug 1
Connecting to remote server at localhost port: 9999
Trying to connect to server...
Connected.
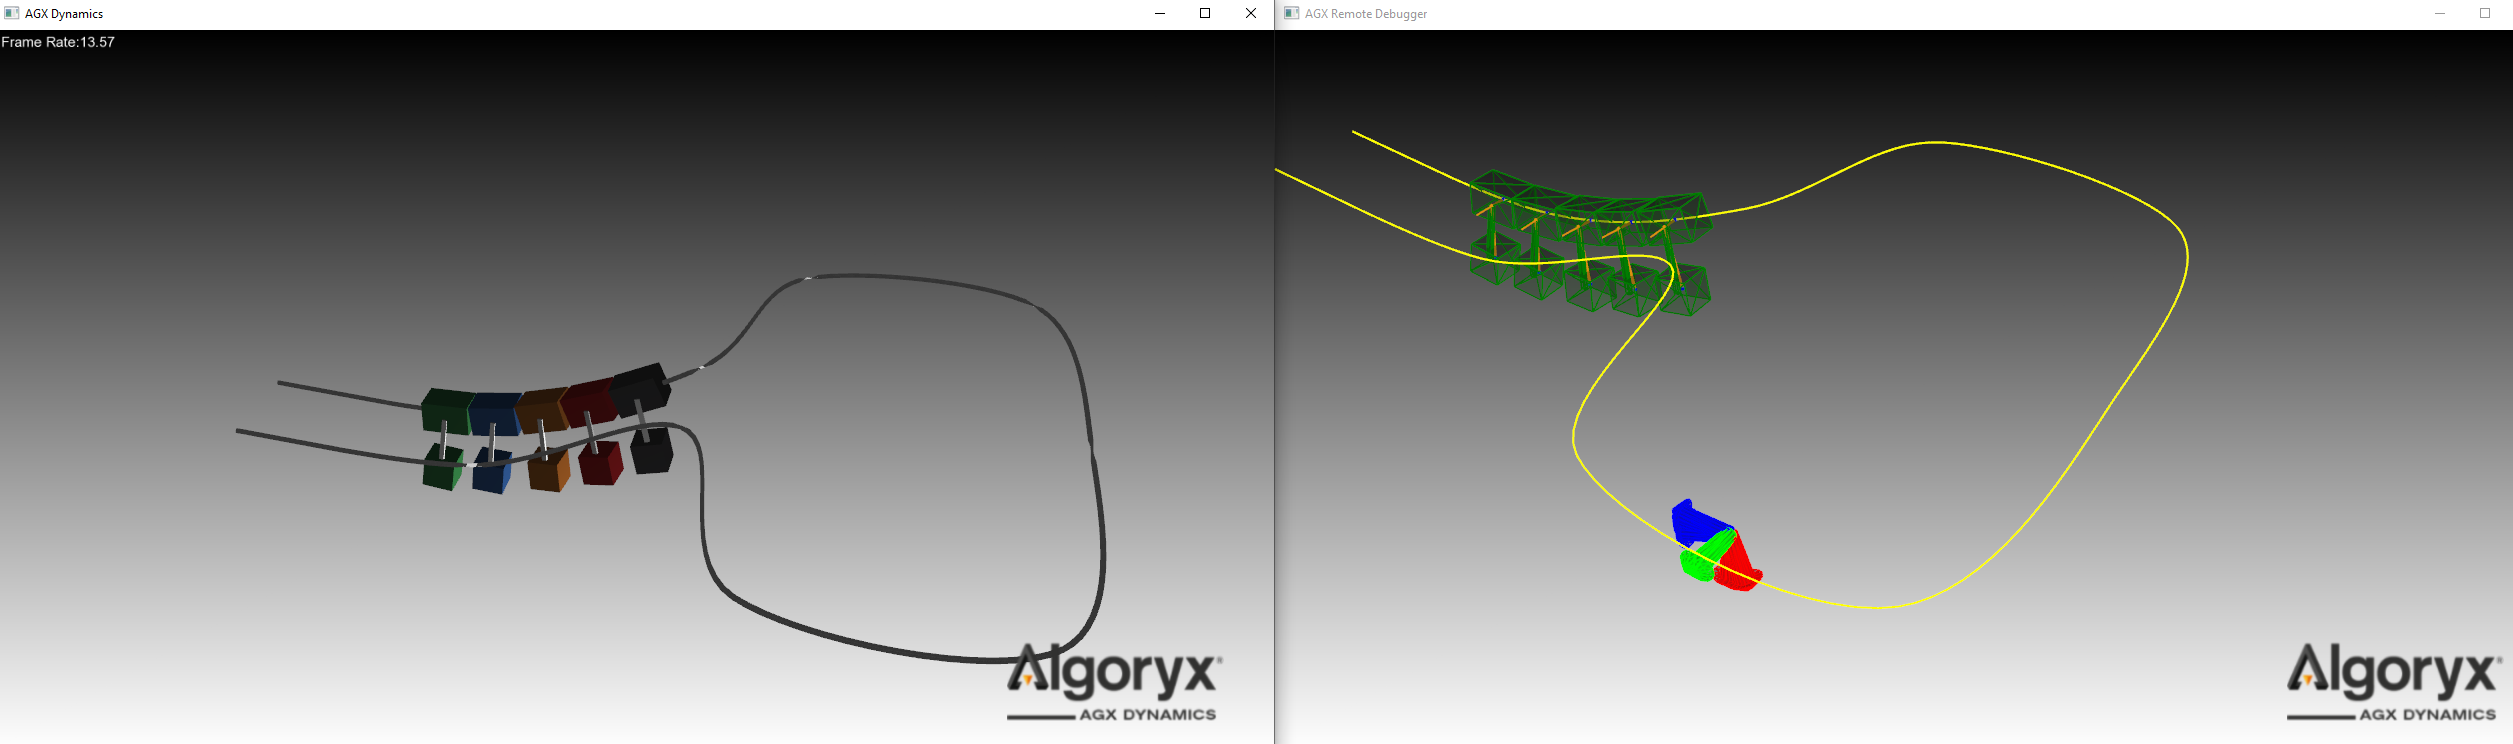
Fig. 54.3 The image to the left show the running simulation and the one to the right show the remote debugger view.
Lets look at the arguments of the two commands. On the server side we have:
--server- Indicates that a port should be setup where the server will wait for a connection. The port can be changed using the--serverPort <portnum>argument. Default is 9999--serverTimeStep 0.1- specifies the rate by which the simulation will be streamed over the network connection in ms. This should be a multiple of the current simulation time step.--serverWait 0- If this is set to 0 (disabled) the server will not wait for a ready signal from the client and instead just push data onto the network. Hence synchronization between client and server will not be upheld.and finally the script that should be executed.
On the client side we have the following arguments:
--connect localhost:9999- This specifies the network ip adress to where the server is running. In this case localhost (127.0.0.1) and a specified port (9999). If port is omitted, the default port 9999 will be used.-por--startPaused- This is important as it will start agxViewer in paused mode. This will show the data being streamed into the client. If this was omitted, or if you press ‘e’ key to start the simulation, you would no longer stream data into the client, instead you are running the actual simulation locally. This is enabled by the fact that we are doing full de-serialization of the simulation.--renderDebug 1- This will enable the debug renderer so that we can actually see the parts of the simulation.
54.3.2. Enabling remote debugging in an application
The remote debugging feature can be enabled for any agxSDK::Simulation instance.
agxSDK::SimulationRef simulation = new agxSDK::Simulation();

// Specify the rate by which we will send data over to the server. Should be a multiple of the simulation time step
double serverTimeStep = simulation->getTimeStep() / 2.0;

// Specify the TCP port on which the server will listen to the connection
agx::Int16 serverPort = 12345;

// Should we compress (zip) the data before sending?
bool compressData = false;

// Lets not wait for client to be ready for new data. Just send new packages as fast as we can
bool waitForClient = false;

simulation->setRemoteDebuggingTimeStep(serverTimeStep);

// Enable the remote debugging
simulation->setEnableRemoteDebugging(true, serverPort, compressData, waitForClient);
54.3.3. Performance of remote debugging
Due to the full serialization of the simulation state each time it is being synchronized, the performance can be very much affected. Large objects such as heightfield, triangle meshes and terrains can lead to very slow remote debugging.
In those cases where you cannot achieve acceptable performance you can disable serialization for some of the larger objects.
For example if you have a heightfield as a seabed, but you are mostly interested in looking at some mechanical simulation above the heightfield, then you can call the Serializable::setEnableSerialization(bool) method.
// Disable serialization for a agxTerrain::Terrain

terrain->setEnableSerialization(false);

// This will lead to better performance in remote debugging.
// Note that you probably have to loop through your geometries and look for
// triangle meshes/heightfields that you want to disable for serialization.
heightfield_geometry->setEnableSerialization( false );
54.4. Logging system
AGX contains a mechanism for logging messages to file, callbacks and/or console which is implemented through two classes, agx::Logger and agx::Notify. Notify is a class derived from std::ostringstream so it can be treated as any std::ostream using the overloaded << operator. The logging functionality is accessed through a number of macros defined in <agx/Logger.h>.
There are four different levels of messages as seen in Table 49.3: Values for Notify level
Macro name |
Description |
|---|---|
LOGGER_DEBUG() |
Start new debug message. |
LOGGER_INFO() |
Start a new information message. |
LOGGER_WARNING() |
Start a new warning message. |
LOGGER_ERROR() |
Start a new error message. |
LOGGER_END() |
Commit the started message (if the message is an error and an exception should be thrown, the actual error is thrown after this call). |
LOGGER_ENDL() |
Same as LOGGER_END() but add a std::endl to the stream. |
LOGGER_STATE() |
Change the output state for this message. Determines what is written as a message, line number, current function etc. |
Examples of using the LOGGER macros:
LOGGER_WARNING() << "The file: " << filename << " cannot be read" <<
LOGGER_ENDL();

LOGGER_INFO() << LOGGER_STATE(agx::Notify::PRINT_NONE) <<
  "This is a plain message with no extra information " << LOGGER_ENDL();

LOGGER_ERROR() << "A serious problem has occurred" << LOGGER_END();
The last example with LOGGER_ERROR() will throw an exception if LOGGER().setExceptionOnError( true ); is called prior to the call.
54.4.1. Setting Logging level
The level of output/logging can be specified either via Environment variables or via the C++ API:
#include <#include <agx/Logger.h>
// For logging to file/streams opened via NOTIFY().openLog(filename);
// This occurs automatically whenever a Logger::instance() is created and is controlled via the environment variable AGX_LOG_ENABLE
// setLogNotifyLevel specifies what goes into the log file.
//
// The example below will indicate that we only want warning and higher (error) messages written to the log file.
// debug and info will not be displayed in the logfile.
NOTIFY().setLogNotifyLevel( agx::Notify::NOTIFY_WARNING );
If you want to control the output to the console (might or might not be written to the log file depending on the setLogNotifyLevel).
#include <#include <agx/Logger.h>
// For logging to console
// Show only warning and higher (error) messages.
// debug and info will not be displayed in the console
NOTIFY().setNotifyLevel( agx::Notify::NOTIFY_WARNING );
54.4.2. Redirecting Logger messages
Messages that are generated during runtime can contain important information. For example when reading mesh data the constructor of agxCollide::Trimesh can generate warnings about the validity of the mesh.
If there is no console available, these messages will not be shown to the user. Either one have to enable the logging to file functionality through Table 49.1 or through the API:
bool overwrite = true; // overwrite if there is already a log file with this name
bool closeAndOpen = true; // If a log file is already open, close it and open the new, otherwise keep the previous one opened
LOGGER().openLogFile( "c://temp/logfile.txt", overWrite, closeAndOpen );
There are also a number of ways to capture the messages written to the LOGGER system.
54.4.2.1. Deriving from a callback
In many situations it is possible to derive from the agx::NotifyCallback class and recieve messages.
Note
Callbacks are triggered from within the std::ostream system in C++. This can cause some issues in certain cases. For example in multi-threaded environments or when used in a C# context such as Unity3D. In those cases we recommend to use the LoggerSubscriber.
To recieve messages through callbacks, one derives a class from agx::NotifyCallback and implements the message method.
class MyNotifyCallback : public agx::NotifyCallback
{
public:
  MyNotifyCallback() {}
  ~NotifyCallback() {}

  /// Virtual method called whenever there is a message ready
  void message( const agx::String& msg, int notifyLevel) override
  {
    // Handle the message
  }
};

agx::ref_ptr<MyNotifyCallback> callback = new MyNotifyCallback();
// Register the callback
LOGGER().addCallback(callback);

// Unregister the callback
LOGGER().removeCallback(callback);
54.4.2.2. Subscribing to messages
When you want to have full control over when messages are handled, the agx::LoggerSubscriber is a better option.
It works like a mailbox. You setup the system and poll messages using the poll() method.
// Specify which levels you want to listen to
int levelMask = agx::Notify::NOTIFY_ERROR | agx::Notify::NOTIFY_WARNING | agx::Notify::NOTIFY_INFO;

agx::ref_ptr<agx::LoggerSubscriber> subscriber = new LoggerSubscriber(levelMask);

/*
Run simulation....
*/

// Now we want to check for messages:
if (!subscriber->empty()) {
  std::string messages = subscriber->pop();
  std::cerr << "The message: " << message << std::endl;
}

// There is a "mail queue" for each level, so we can check them individually.
// We can store the messages in an array also:
agx::StringVector messages;

// Are there any warnings?
size_t numMessages = subscriber->pop(messages, agx::Notify::NOTIFY_WARNING);