39. Statistics
AGX has several methods for measuring time and obtain statistics about timings in different parts of the simulation.
39.1. Timer
The agx::Timer can be used to measure the duration of the execution of compute-intensive code. The timer is based on hard-ware, using either the hardware’s Time Stamp Counter or High Precision Event Timer (platform-dependent, please look at include/agx/Timer.h for details).
Timers can be started, stopped, (re-)started, or reset. They can be queried for their current time, which is given in milliseconds. The precision is between 100s of nanoseconds and microseconds (depending on hardware and operating system).
An example of the usage:
// Create a timer. It will started in the stopped (= "paused") state by default.
agx::Timer t;
//...do some thing else...
t.start();
// We want to measure this part of the code, call it section 1.
t.stop();
// We do NOT want to measure this part of the code, call it section 2.
t.start();
// Again, we want to measure this part of the code, call it section 3.
t.stop();
std::cout << "Section 1 and 3 together took " << t.getTime() << "ms.\n";
t.reset();
// Now, the timer is set to 0 again, and stopped. It can be used for other purposes now.
39.2. agx::Statistics
AGX has internal functionality for registering and reporting runtime statistics of a simulation. agx::Statistics is a singleton and can be accessed through a call to:
agx::Statistics::instance()
Various classes register into the statistics singleton and report both timing and other data related to statistics. The collection of data can be accessed in various ways. Through the debug rendering as overlay in the graphics of your application:
The statistics information presented in the graphics window is a subset from the complete set of data points stored. What is displayed in the graphics window can be changed in the file settings.cfg which should be located in <agx-dir>/data/cfg/settings.cfg.
To enable statistics rendering in the graphics window do the following calls:
agxSDK::SimulationRef sim = new agxSDK::Simulation;
agx::Statistics::instance()->setEnable( true );
sim->getRenderManager()->enableFlags(agxRender::RENDER_STATISTICS);
Or slightly more compressed:
sim->setEnableStatisticsRendering ( true );
If you want to get all the statistics information into a file, you can specify that through the simulation class:
agxSDK::SimulationRef sim = new agxSDK::Simulation;
sim->setStatisticsInterval( 1 ); // report every second

// Specifies a path to a file that will contain statistics info
sim->setStatisticsPath( "myStat.txt" );

sim->setEnableStatistics( true ); // Enable statistics reporting to file
This behavior can also be controller through environment variables read by the Simulation class when it is instanced. For more information see Section 45.
39.3. Statistics API
It is possible to readout the current statistics value after a call to Simulation::stepForward(). This is done through the singleton agx::Statistics::instance()
The C++ tutorial tutorial_statistics.cpp demonstrate how to access all the various statistics data that is available.
// Get the total time spent in AGX (and listeners)
agx::TimingInfo info =
  agx::Statistics::instance()->getTimingInfo("Simulation", "Step forward time");

// The last reported value
std::cerr << info.current;

// The accumulated value since start of the simulation
std::cerr << info.accumulated;
Statistics also collect other data, such as number of rigid bodies etc.:
agx::TimingInfo bodies =
  agx::Statistics::instance()->getTimingInfo("DynamicsSystem", "Num enabled rigid bodies"");
The available data can be queried by enabling statistics, running an application with AGX Dynamics and look at the generated statistics file (agx_statistics.txt):
cmd> set AGX_STATISTICS_ENABLE=1
cmd> set AGX_STATISTICS_INTERVAL=1
cmd> tutorial_constraints
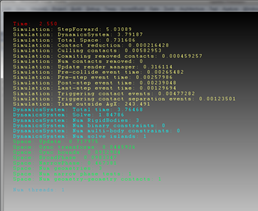
Below is a snippet from that file. Red marks the name of the module, and Blue marks the name of the data. These strings can be used in the code listed above to receive the statistics data from a running simulation.